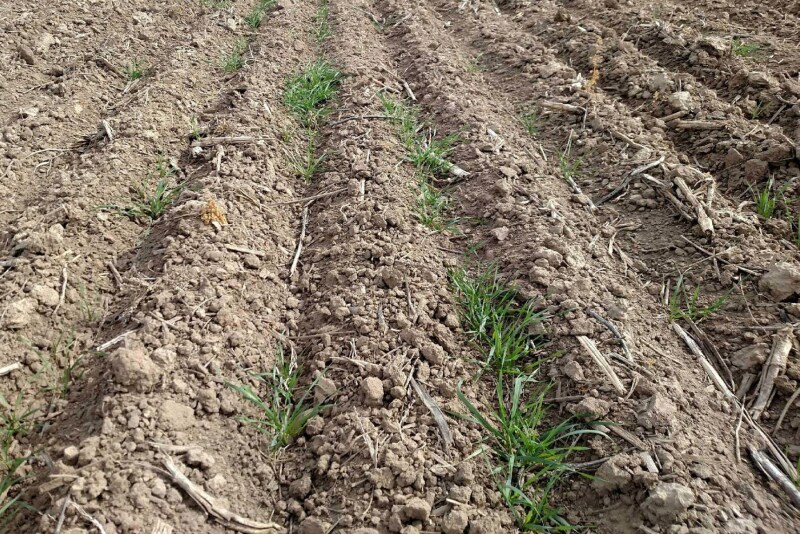
When USDA’s weekly crop condition ratings are plugged into the weighted Pro Farmer Crop Condition Index (0 to 500-point scale, with 500 being perfect), the HRW crop improved 4.7 points to 270.6 while the SRW crop rose 6.6 points to 357.0. The bulk of the improvement for HRW was in Montana, while the SRW improvement was largely in Illinois, Michigan and Ohio. Despite the weekly improvements, CCI ratings remained 71.3 points below the five-year average for HRW and 5.3 below for SRW.
Pro Farmer Crop Condition Index for HRW Wheat | |||
| This week | Last week | Year-ago |
Kansas (39.61%*) | 105.35 | 105.35 | 161.05 |
Oklahoma (12.81%) | 32.92 | 32.79 | 50.99 |
Texas (7.77%) | 19.58 | 18.80 | 25.34 |
Colorado (6.52%) | 16.88 | 16.94 | 28.98 |
Nebraska (4.52%) | 12.06 | 12.38 | 20.68 |
S. Dakota (4.44%) | 12.30 | 12.57 | 13.79 |
Montana (8.42%) | 28.45 | 24.75 | 24.60 |
HRW total | 270.64 | 265.92 | 332.89 |
* denotes percentage of total national HRW crop production.
Pro Farmer Crop Condition Index for SRW Wheat | |||
| This week | Last week | Year-ago |
Missouri (9.72%*) | 33.43 | 34.11 | 35.56 |
Illinois (15.64%) | 51.94 | 50.22 | 59.99 |
Ohio (14.11%) | 49.68 | 48.41 | 44.74 |
Arkansas (2.51%) | 9.88 | 9.96 | 6.65 |
Indiana (7.33%) | 26.69 | 27.35 | 25.62 |
N. Carolina (7.87%) | 30.47 | 29.05 | 23.13 |
Michigan (13.90%) | 51.71 | 50.04 | 46.29 |
SRW total | 357.01 | 350.46 | 367.13 |
* denotes percentage of total national SRW crop production.

