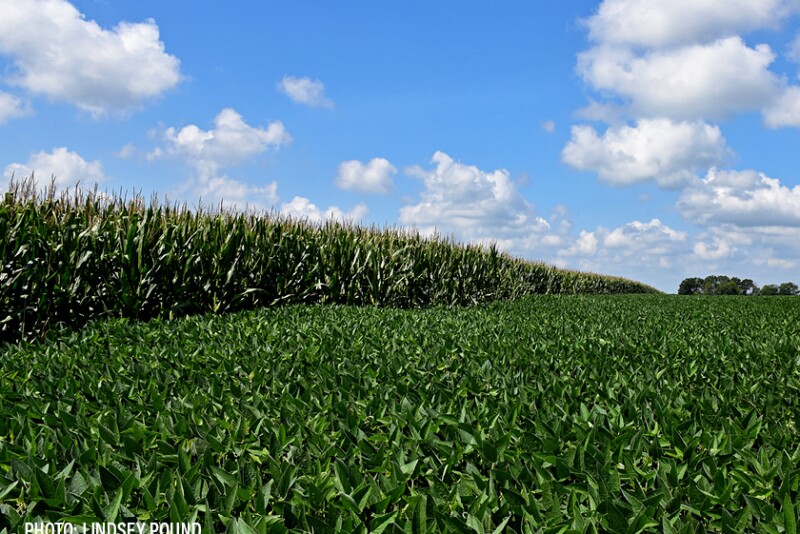
When USDA’s weekly condition ratings are plugged into the weighted Pro Farmer Crop Condition Index (CCI; 0 to 500-point scale, with 500 representing perfect), the corn crop fell 1 point to 349, still 8.17 points (2.3%) below a year ago. Conditions worsened in 11 of the top 18 corn production states. The soybean CCI fell 1 point to 338.3, still 12.4 points (3.5%) below a year ago. Conditions worsened in 9 of the 18 top soybean production states. The top two production states, Iowa and Illinois, saw conditions improve despite the falling national average. Spring wheat conditions gave up recent improvements, falling 2.8 points to 336.4. This is still 36.1 points (9.7%) below a year ago. Top producer North Dakota fell slightly, but conditions in each of the six states fell.
Pro Farmer Crop Condition Index for Corn | |||
| This Week | Last week | Year-ago |
Colorado (0.91%*) | 3.33 | 3.47 | 3.29 |
Illinois (15.33%) | 49.68 | 48.76 | 53.75 |
Indiana (6.95%) | 24.55 | 24.48 | 21.62 |
Iowa (17.02%) | 61.60 | 62.11 | 67.88 |
Kansas (4.72%) | 16.92 | 16.30 | 16.39 |
Kentucky (1.72%) | 6.20 | 6.03 | 5.26 |
Michigan (2.30%) | 7.47 | 7.59 | 7.62 |
Minnesota (9.98%) | 34.83 | 36.03 | 34.60 |
Missouri (3.75%) | 10.23 | 10.76 | 12.23 |
Nebraska (11.86%) | 42.82 | 43.29 | 43.64 |
North Carolina (0.79%) | 3.01 | 3.07 | 2.19 |
North Dakota (2.28%) | 8.25 | 8.32 | 9.41 |
Ohio (4.20%) | 15.68 | 15.93 | 13.32 |
Pennsylvania (0.99%) | 3.67 | 3.64 | 4.11 |
South Dakota (4.93%) | 17.61 | 17.85 | 17.24 |
Tennessee (0.94%) | 3.52 | 3.65 | 2.97 |
Texas (1.45%) | 5.55 | 5.18 | 4.81 |
Wisconsin (3.71%) | 12.54 | 11.87 | 13.91 |
Corn total | 348.96 | 349.91 | 357.13 |
* denotes percentage of total national corn crop production.
Pro Farmer Crop Condition Index for Soybeans | |||
| This Week | Last week | Year-ago |
Arkansas (3.58%*) | 13.79 | 13.28 | 12.49 |
Illinois (15.24%) | 49.39 | 48.48 | 54.29 |
Indiana (7.81%) | 27.56 | 27.64 | 25.76 |
Iowa (13.31%) | 47.12 | 47.12 | 51.41 |
Kansas (4.01%) | 14.26 | 14.14 | 15.62 |
Kentucky (2.34%) | 8.49 | 8.33 | 6.84 |
Louisiana (1.28%) | 4.95 | 4.90 | 4.50 |
Michigan (2.47%) | 7.72 | 7.92 | 8.28 |
Minnesota (8.45%) | 29.65 | 30.58 | 30.52 |
Mississippi (2.47%) | 9.64 | 9.54 | 7.75 |
Missouri (6.55%) | 18.28 | 19.33 | 21.47 |
Nebraska (7.17%) | 24.72 | 24.29 | 27.23 |
North Carolina (1.47%) | 5.46 | 5.68 | 5.02 |
North Dakota (4.43%) | 14.83 | 15.32 | 16.49 |
Ohio (6.41%) | 23.34 | 23.21 | 21.55 |
South Dakota (4.90%) | 17.14 | 17.39 | 17.54 |
Tennessee (1.81%) | 1.00 | 1.00 | 1.00 |
Wisconsin (2.57%) | 8.31 | 8.44 | 9.63 |
Soybean total | 338.32 | 339.28 | 350.72 |
* denotes percentage of total national soybean production.
Pro Farmer Crop Condition Index for HRS Wheat | |||
| This Week | Last week | Year-ago |
Idaho (7.48%*) | 26.78 | 27.00 | 28.54 |
Minnesota (14.39%) | 53.54 | 54.11 | 53.02 |
Montana (15.98%) | 52.74 | 53.06 | 56.70 |
North Dakota (50.94%) | 169.62 | 170.64 | 195.05 |
South Dakota (6.13%) | 17.85 | 17.91 | 18.97 |
Washington (5.07%) | 15.88 | 16.49 | 20.21 |
HRS total | 336.41 | 339.22 | 372.49 |
* denotes percentage of total national HRS crop production.

