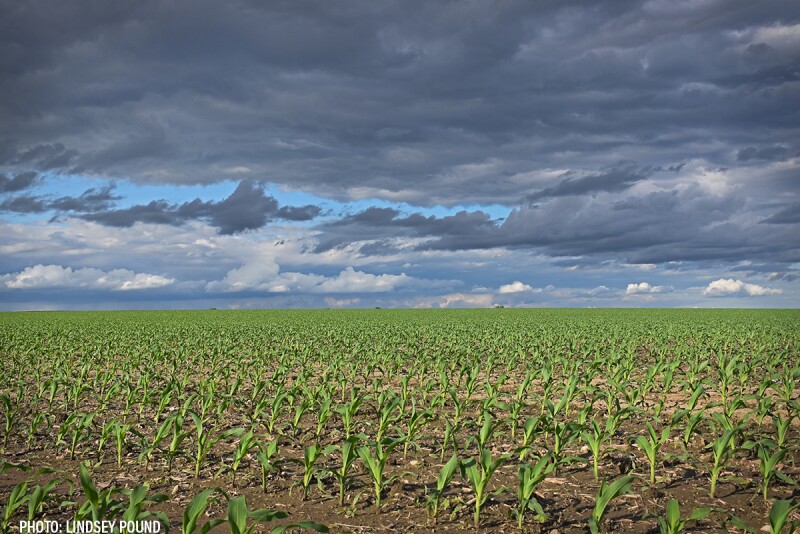
USDA rated 72% of the corn crop as “good” to “excellent” and 5% “poor” to “very poor.” The soybean crop was rated 70% “good” to “excellent” and 5% “poor” to “very poor.” On the weighted Pro Farmer Crop Condition Index (CCI; 0 to 500-point scale, with 500 representing perfect), the corn crop dropped 4.5 points to 381.0, while the soybean crop fell 3.3 points to 370.0. The biggest declines for both crops were in Illinois. Both corn and soybeans remained rated well above year-ago at this time.
USDA rated 76% of the spring wheat crop as “good” to “excellent” and 4% “poor” to “very poor.” On the CCI, spring wheat improved 6.9 points to 382.3, sharply above last year at this time.
Pro Farmer Crop Condition Index for Corn | |||
| This Week | Last week | Year-ago |
Colorado (0.88%*) | 3.12 | 3.23 | 3.55 |
Illinois (15.31%) | 56.79 | 59.39 | 48.76 |
Indiana (7.00%) | 26.53 | 26.60 | 24.13 |
Iowa (17.12%) | 65.89 | 65.72 | 61.09 |
Kansas (4.26%) | 15.54 | 15.63 | 16.63 |
Kentucky (1.73%) | 6.15 | 6.08 | 6.13 |
Michigan (2.31%) | 9.00 | 8.88 | 6.97 |
Minnesota (9.89%) | 38.08 | 38.28 | 36.92 |
Missouri (3.65%) | 13.70 | 13.44 | 12.26 |
Nebraska (11.45%) | 46.26 | 46.83 | 41.39 |
North Carolina (0.83%) | 2.67 | 3.09 | 2.87 |
North Dakota (2.88%) | 10.76 | 10.67 | 8.21 |
Ohio (4.35%) | 16.56 | 16.95 | 15.13 |
Pennsylvania (0.77%) | 3.19 | 3.14 | 3.19 |
South Dakota (5.11%) | 19.78 | 20.09 | 16.37 |
Tennessee (0.94%) | 3.56 | 3.47 | 3.42 |
Texas (1.47%) | 5.21 | 5.14 | 5.57 |
Wisconsin (3.71%) | 14.08 | 14.16 | 12.50 |
Corn total | 381.04 | 385.22 | 346.48 |
* denotes percentage of total national corn crop production.
Pro Farmer Crop Condition Index for Soybeans | |||
| This Week | Last week | Year-ago |
Arkansas (3.71%*) | 14.17 | 14.06 | 13.79 |
Illinois (15.58%) | 56.23 | 58.88 | 48.48 |
Indiana (7.81%) | 29.53 | 29.53 | 27.25 |
Iowa (13.89%) | 53.34 | 53.20 | 46.98 |
Kansas (3.31%) | 12.53 | 12.47 | 14.58 |
Kentucky (2.34%) | 8.45 | 8.38 | 8.54 |
Louisiana (1.17%) | 4.57 | 4.52 | 4.93 |
Michigan (2.39%) | 8.85 | 9.00 | 7.13 |
Minnesota (8.34%) | 31.84 | 31.84 | 30.92 |
Mississippi (2.39%) | 9.16 | 9.26 | 9.49 |
Missouri (6.33%) | 23.09 | 22.65 | 21.49 |
Nebraska (6.93%) | 27.67 | 27.46 | 23.79 |
North Carolina (1.49%) | 5.20 | 5.61 | 5.38 |
North Dakota (4.64%) | 17.17 | 16.99 | 15.32 |
Ohio (6.47%) | 24.39 | 24.84 | 22.89 |
South Dakota (4.89%) | 18.50 | 18.99 | 16.50 |
Tennessee (1.81%) | 1.00 | 1.00 | 1.00 |
Wisconsin (2.60%) | 9.82 | 10.02 | 8.75 |
Soybean total | 370.00 | 373.32 | 339.93 |
* denotes percentage of total national soybean production.
Pro Farmer Crop Condition Index for HRS Wheat | |||
| This Week | Last week | Year-ago |
Idaho* (7.48%) | 28.35 | 28.27 | 27.15 |
Minnesota (14.39%) | 57.14 | 54.55 | 50.95 |
Montana (15.98%) | 58.50 | 56.90 | 53.06 |
North Dakota (50.94%) | 198.15 | 195.09 | 174.72 |
South Dakota (6.13%) | 22.51 | 22.39 | 18.16 |
Washington (5.07%) | 17.66 | 18.22 | 16.69 |
HRS total | 382.30 | 375.41 | 340.73 |
* denotes percentage of total national HRS crop production.

